Excel Copilot Built an Expense Dashboard in Two Minutes
Copilot's interactive canvas in Excel produced a 1,000-row expense dashboard in two minutes, with cross-filtering, animated charts and automatic updates when data changes.
- AuthorSophie Lindqvist
- ChannelAI & Emerging Interfaces
- Filed
- Read3 min
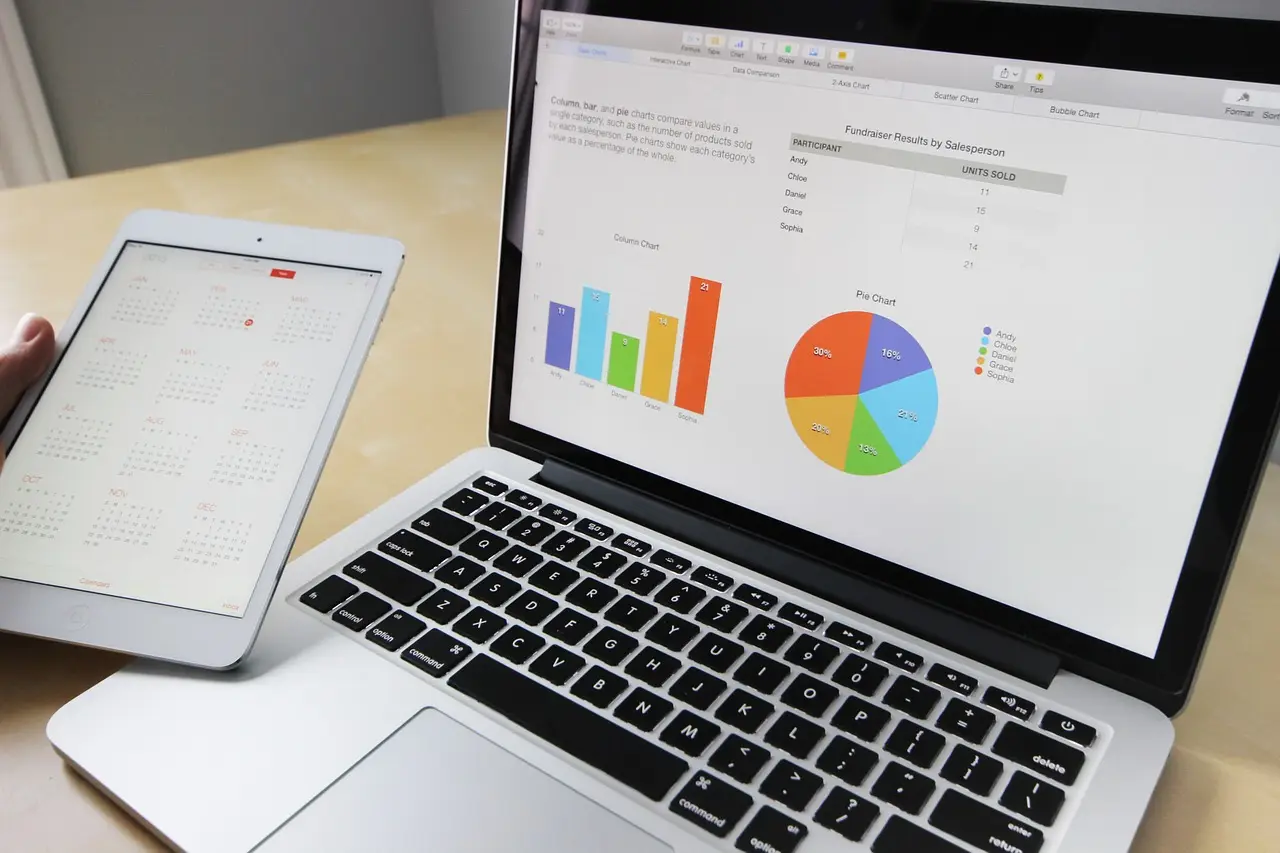
- Copilot generated a travel and expense dashboard from about 1,000 rows in roughly 2 minutes.
- September data showed 161 transactions over $500 and 20 over $1,000 via a slider filter.
- The canvas behaves like a web page: no visible cells, grayed-out ribbon, all edits through Copilot.
- A project status report showed overall red RAG status and 87 days to go live.
- Reports update automatically; a $50,000 edit changed totals instantly, reversing without a refresh.
Microsoft Copilot's interactive canvas in Excel generated a working travel and expense dashboard in roughly two minutes from a single prompt, with cross-filtering charts, dropdown filters and animated visualizations that native Excel cannot produce.
The demonstration, published by Excel trainer Leila Gharani, started from a dataset of about 1,000 rows covering expenses by person, category, location, amount and receipt status. The prompt read: "Use the interactive canvas to create a travel and expense report for finance team. Total spent, spent by department, category, and month, missing receipts, and anything that stands out."
The generated dashboard included KPI cards for total spend, transaction count, missing receipts and average expense, plus charts for spending by department, category and month. Dropdown filters covered department, category, month and receipt status, with a reset option.
What can users actually do with it?
Interactivity works the way it does on a web page rather than in a spreadsheet. Clicking a chart element cross-filters the whole report. A slider filtering expenses above a minimum amount surfaced 161 transactions over $500 and 20 transactions over $1,000 in September. Filtering September showed hotel as the largest category, with the Desert Wister resort as a significant expense. Filtering April highlighted four missing receipts, all from one employee, Adam; clicking operations showed zero missing receipts while sales showed four and 572 transactions.
One rough edge emerged. Clicking "total spend" displayed "expenses behind total spend" but showed only up to 50 items, even when the filtered view indicated 128 expenses. Moving the slider to $700 cut the list to 21.
How does the canvas differ from a normal sheet?
The canvas behaves like an embedded web page inside Excel. It sits on its own sheet with no visible cells, and the ribbon and formula bar are grayed out. Copilot reads the table directly. The trade-off is control: users cannot right-click to change colors or adjust elements, and every modification must go through Copilot. Calculations stay hidden, though users can ask Copilot for the logic or request a separate calculation sheet.
What about the project status report?
Copilot can also consolidate multiple sheets into one report. A steering-committee project status report drew on a workbook with sheets for tasks, team members, risks and budget. The output contained:
- A scrollable Gantt chart with toggleable dependency lines and an option to include or exclude completed tasks, planned tasks in gray and actual progress in green
- RAG status per workstream and overall status in red, with 87 days to go live
- An open risk matrix showing top risks and a budget-versus-actual comparison
- A highlighted delay caused by the "Mexico connector" that pushed the project's sign-off date
A play button on the Gantt chart stepped through the project timeline, showing status shifting from green to amber to red — a narrative of how the delays unfolded. Calculations were placed on a separate sheet for transparency.
Do the reports update themselves?
Yes, and without manual refresh. Changing an expense amount to $50,000 immediately updated the total spend — previously 251,852 — and related figures; reversing the edit restored the original totals. A "play findings" button runs a guided tour, applying filters automatically and highlighting key points, which reduces preparation work for presentations.
Animated charts, previously unavailable in Excel, extend this storytelling capacity. One prompt produced a top-10 customer ranking by monthly net sales with a play button stepping through each month; Harbor Foods ranked second in July before climbing to first later in the year.
What remains constrained?
Users accustomed to full control will need to adjust. Direct editing is restricted, calculation visibility is limited unless requested, and if the interactive canvas skill is turned off, it must be named explicitly in the prompt to work. For teams that accept those constraints, Copilot turns Excel into a generator of dashboards and status reports that once required separate BI tooling.
Source: geeky-gadgets.com
More from Sophie Lindqvist
Show full bio
Staff writer covering people, launches and day-to-day practice in Product and interaction design, design systems at Interface Wire.
84 articles